Network
The network page gives the user access to some more specific data on the status of the server which Master Patch runs in order for remote viewers to connect and receive data.
This page is intended to give the user an introduction to the Networking page within the preferences section, which is where the user can view information about the server which Master Patch runs in order for remote viewers to connect and receive data..
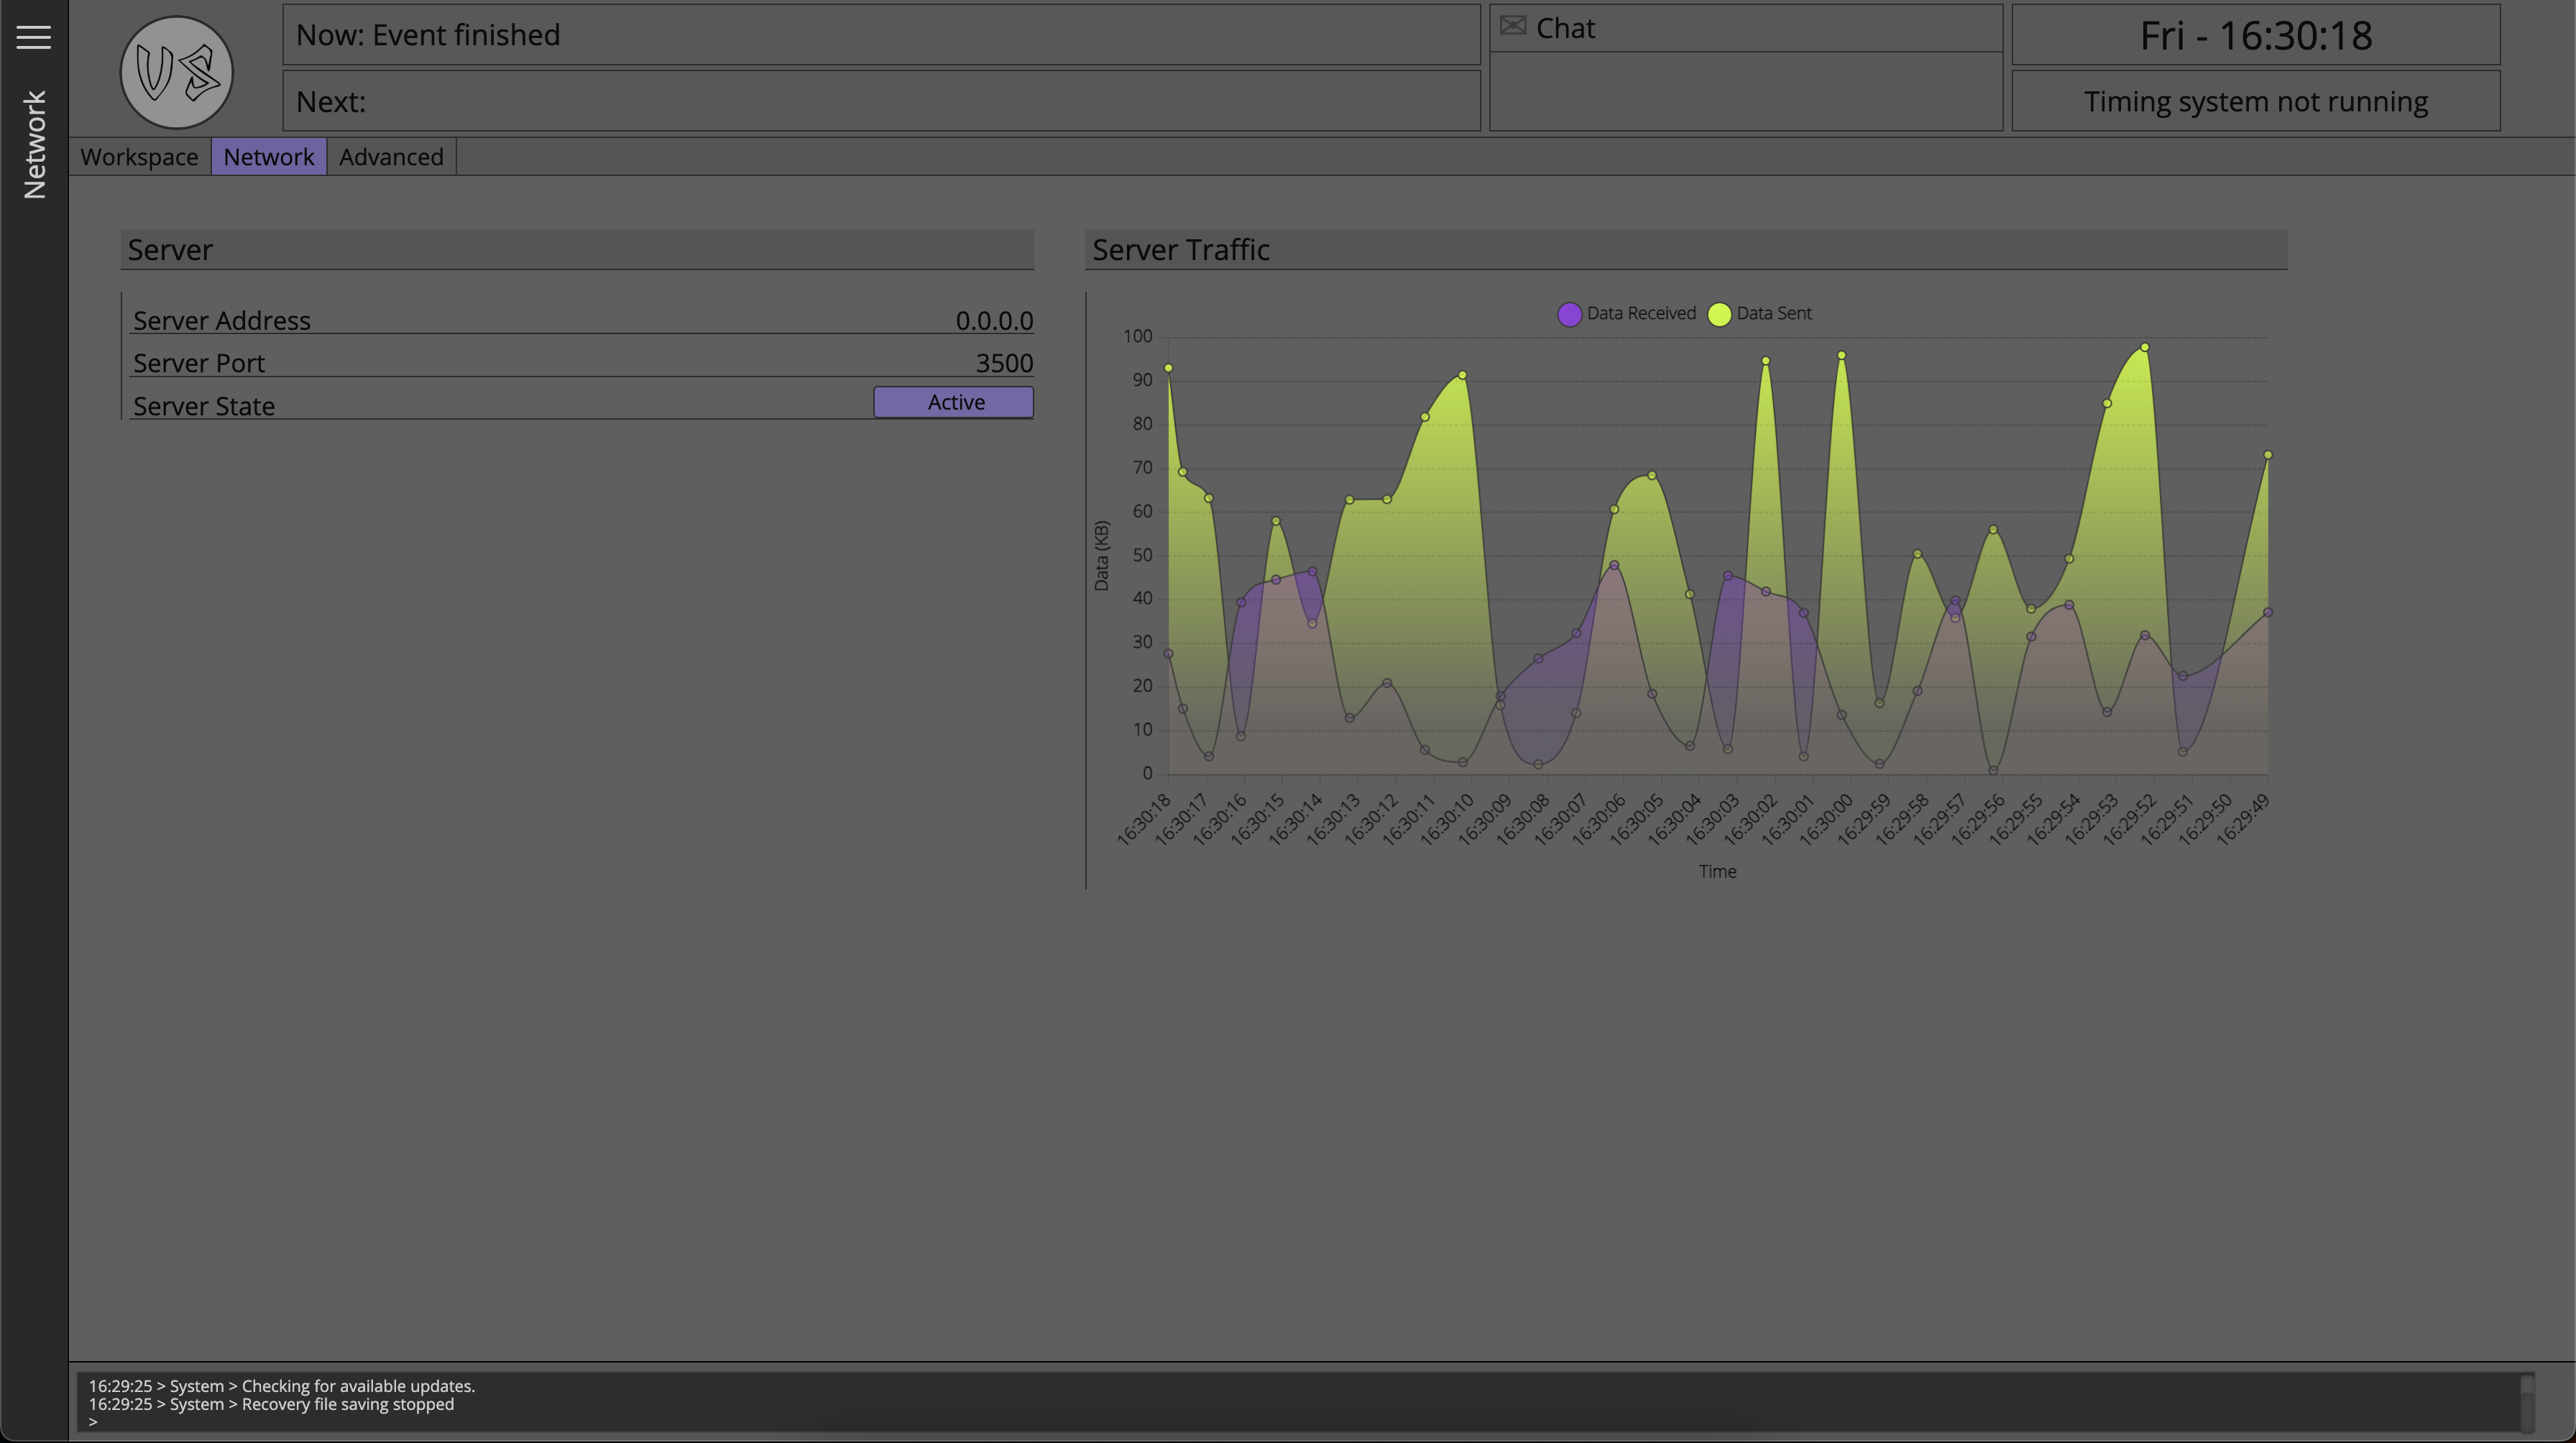
Server Address
This field shows the IP address on which the server is currently running.
At present, while the user is not able to select which network adapter they want to use for Master Patch, this field will always show 0.0.0.0
This address does not mean that remote viewer users should use IP address 0.0.0.0 to connect to Master Patch, what this means is that Master Patch will accept a connection on all of its available network interfaces using the IP address of that network adapter.
For example if the Master Patch computer has a wired network adapter using an address of 192.168.1.100 and also has a wireless network adapter connected to a different network using an address of 10.20.30.200 then a remote viewer application could use the address of the network it is connected to in order to connect to the instance of Master Patch.
It is advised to keep all devices accessing Master Patch on a single network rather than using multiple network adapters in the Master Patch computer.
Server Port
The default port number for Master Patch is 3500, however if when the server is starting up port 3500 is in use by another service on the Master Patch machine, then Mater Patch will dynamically assign itself an available port to ensure there are no conflicts.
The port number on which the server is running is displayed in this field.
Server State
The toggle button next to server state field allows the user to suspend and start the server.
By default the server is always running when the application starts and does not need to be manually started.
Server Traffic
The server traffic chart tracks the amount of data being received by Master Patch from clients and data being sent by Master Patch to clients, in real-time.
The graph in the image is made with mock data for the purpose of demonstration, and does not necessarily represent expected results of a real world, live situation.
Traffic received by the Master Patch is generated by requests for data from clients and will generally be a much smaller number than data sent.
Traffic being sent by Master Patch is the data being returned to clients, such as data on a selected day, a selected act or an act file attachment.
The server helps the user to have an understanding of the real-time bandwidth requirements of Master Patch to its clients, and can be a helpful troubleshooting tool.
The values shown in the graph represent the total amount of data sent or received since the last measurement took place, that is to say, after each measurement interval the data measurement buffer is reset.
The data from the graph is not recorded or stored by Master Patch at any time.